

Exports increased by 5.2% to EUR 163.1 billion, and imports by 5.5%, to EUR 165.6 billion. As a result, the total foreign trade deficit increased by as much as 23% on a year-over-year basis, from EUR -1.984 to -2.446 billion. The total share of agricultural products in overall exports exceeded 13%, whereas in the case of imports, it amounted to less than 9%. In both the import and export of food, a drop in their share in overall trade occurred. A positive trade balance was recorded again in the foreign trade of agricultural and food products, contrary to the overall trade.
In 2014, the share of total exports to developed countries increased by 2 pp to 84%, the significance of the EU countries increased by the same value to 77%, the share of developed third countries remained stable (7%). In the case of developed countries, 2014 saw, nearly, an 8% increase in exports, whereas the dynamics in developed countries excluding the EU were significantly lower, approaching 3%. The share of the Eurozone in exports increased by 2 pp to 54%, and the positive dynamics of exports exceeded 9%. A higher growth rate of exports in this direction could be explained by the good economic situation. According to the International Monetary Fund, GDP increased in 2014 by 3.3% worldwide and by 1.8% in the developing countries. Improvement was also observed in Poland's main trade partners: Germany (+1.4%), France (+0.4%), the United Kingdom (+3.2%), whereas the GDP in the Eurozone increased by 0.8%. The share of exports in third countries (excluding developed ones) decreased by 2 pp to 16% due to an almost 6% drop of exports in this direction. Exports to the CIS dynamically decreased by almost 17%, and the share dropped to 8% (less by 2 pp YOY). The share of developed countries without the EU did not change (7%).
With regard to imports, a minimally higher growth rate was recorded than in exports (5.5 compared to 5.2%), the growth dynamics for the Eurozone were almost twice as high as for other EU countries, while purchases from the CIS and non-EU developed countries dropped (by slightly above 3% each). 65% of imports reached Poland from the developed countries (less by 1 pp), whereas imports from the EU amounted to 59% (+ 1 pp), and from the Eurozone, 46% (unchanged). The share of purchases in the CIS dropped by 1 pp to 13%. Due to a 14% growth in imports, the share of imports from third countries excluding developed ones and the CIS increased by 2 pp to 22%. Imports from developed countries (including the EU) showed positive dynamics (4.6%), although lower than the total imports (+5.5%), while the imports from third countries excluding developed ones increased at a rate higher than average (+7.2%), which allowed an increase of the shares of this group, in the geographical structure of the imports, by 1 pp to 35%.
Due to slightly higher growth dynamics in imports than in exports in 2014, the deficit in the balance of the foreign trade distinctly increased from EUR -1.984 billion to EUR -2.447 billion (+23%). It is also worth noticing a change in the growth rate of trade on a year-to-year basis: in 2013, exports increased by 8% YOY, and imports by 1.9%. In 2014, on the other hand, the growth rate of imports was 5.5% (strong growth YOY), and of exports, 5.2% (a distinct decrease). Trade with the EU countries showed a positive balance amounting to EUR 28.8 billion (including almost EUR 11.2 billion for the Eurozone), the trade with developed countries excluding the EU ended with a deficit of EUR 362 million, which, nevertheless, dropped by as much as 2/3 YOY. The trade exchange with developed countries in total ended with a high positive balance (EUR 28.4 billion). On the other hand, a large deficit had been recorded in the case of third countries excluding the developed ones (EUR -30.9 billion), which increased by 22%. The negative balance of trade with the CIS increased by as much as 29% to EUR -8.4 billion, and with other countries (excluding the developed ones and the CIS) increased by 19% to EUR -22.5 billion.

For many years, Germany has been the most important trade partner of Poland, both in exports and imports. In 2014, sales to the German market increased on a year-over-year basis by 10% to EUR 42.6 billion, while the imports increased by 7% to EUR 36.4 billion. In both cases, the growth dynamics were higher than in the total trade. Germany’s share in Polish trade, in the case of imports, remained unchanged at a level of 22%, and in exports it increased by 1 pp to 26%. Among the top ten largest outlets in value terms, only Russia (a 4% share) was outside the EU. In the case of imports, the top ten largest suppliers included three third countries: Russia (a 11% share), China (11%) and the USA (2%). Trade with the top ten trade partners constituted 65% of exports and 67% of total imports. It is worth noticing the large decrease in the dynamics of purchases from Russia (-9% YOY) and Ukraine (-27%, which made this country fall out of the top ten recipients).
The year 2014 brought a minimal drop in the share of agricultural and food products in the total Polish foreign trade, whereas the growth rate of food exports and imports was noticeably lower than the total trade. The share of exports dropped by 0.1 pp to 13.1%, and of imports, by 0.2 pp to 8.9%.
Of special interest is the slowdown of the growth rate of the share in exports, which had been growing quite strongly for the last three years. The dynamics of imports had been subject to minimal changes in the recent years. Despite weaker dynamics of trade in agricultural and food products than in total trade in 2014, the food trade balance has been positive for years, it increased by 7% to EUR 6.6 billion in 2014. The results of the Polish foreign trade in food, in 2014, were determined by exports to the CIS (-23% YOY), including, above all, Russia (-30%) and Ukraine (-22%), which is connected with the Russo-Ukrainian conflict, the Russian embargo on EU food (assorted products), and the strong depreciation of the rouble and hryvnia. The share of the CIS countries in the geographical structure of Polish food exports decreased in 2014 by 3 pp, from 11% to 8%.
The Ministry of Economic Affairs expects that in 2015, the total Polish exports will increase by 5.5% to EUR 172.1 billion, and the imports will grow slightly slower, by 5% to EUR 173.9 billion (after a study in March 2015). The deficit will amount to EUR 1.8 billion and will be lower in the year-over-year approach.
Commodity structure of the agricultural and food trade
In 2014, the positive balance in the Polish agricultural and food trade increased per annum by 7% to EUR 6.5 billion. The positive trade balance in the section of processed products of animal origin and stimulants improved. In the animal section, the value of the export of milk and dairy products, meat and poultry offal, as well as processed meats increased. The positive balance in the trade of red meat decreased, mainly due to a significant drop in the export of pork and beef. The negative balance in the trade of live animals deepened again due to the continuing high imports of piglets and an increase in the purchase of poultry and cattle. In the plant section, a positive trade balance was recorded again. This was mainly caused by an increase in the export of wheat, grain mill products, starch, feed components and confectionery. The positive balance in the trade of sugar decreased due to a drop in export.
Polish agricultural and food exports were dominated by low-processed products constituting 58% of their value. Highly-processed products had a share of 24%, and unprocessed products – 19%. In comparison with 2013, the share of highly-processed products increased by 1 pp.
The export value of low-processed products increased by 4%, and that of highly-processed products – by 8%, and of unprocessed products – by 3%. In 2014, the animal section saw a 13% decrease of positive balance in the trade of red meat, mainly due to a significant decrease of proceedings from the export of pork (-24%), beef (-19%), and horsemeat (-8%). The export value of poultry meat, on the other hand, increased by 22%, and in the case of sheep and goat meat, by 15%. An increase was also recorded in revenues from the foreign sales of powdered milk (+66%), whey (+10%), processed meats (+8%), honey (+36%), fish and crustaceans (+5%). The value of sales was lower than the year before in the field of live animals (-11%), mostly cattle and horses, as well as animal fats and meals (-16%), cheese and curd (-5%), eggs and egg products (-2%), butter (-1%).


In the vegetable section, as in earlier years, of greatest significance in their export were processed products, the export value of which in 2014, nevertheless, increased only slightly (+0.3%). This group saw an increase in proceeds from the sales of starch, meals and malt (+20%), oil meals, feed ingredients and feed (+8%), confectionery (+6%) and grain mill products (+2%). On the other hand, the export value of sugar was lower than the year before (-30%), due to a drop in its profitability. There were also reductions in earnings from the export of processed vegetables and fruit (-6%), sauces, soups and thickeners (-6%), as well as vegetable oils and fats (-1%). In the group of vegetable raw materials, a positive balance in foreign trade was recorded once more, however, it was lower by 16% than in 2013. A positive balance in the trade of grains increased per annum by one third due to an increase in exports by 21%, mostly of wheat. This was influenced by an increase in the profitability of exports from Poland and other EU countries, due to the loss of profitability of supplies of American wheat and the limitations of Russian export. On the other hand, 2014 saw a reduction in earnings from the export of Polish fruit (-18%), especially apples, due to the Russian embargo imposed in August of the previous year. There was also a decrease in the export value of oilseed rape (-11%), flowers (-12%), and potatoes (-6%).
The first item in the section of other products, and, at the same time, the product with the highest value in the commodity structure of agricultural and food exports, were cigarettes; their export value increased by 8% per year, and the value of total tobacco and tobacco products increased by 27%. There was also an increase in the re-exportation of cocoa, coffee, tea and spices (+15%), the export of waters and soft drinks, (+24%) as well as alcohol and alcoholic drinks (+5%).
The imports of agricultural and food products to Poland in 2014 were dominated, traditionally, by low-processed products (48% of the value of supplies). Unprocessed products had a 33% share in the value of purchases, and highly-processed products – a 19% share. Within a year, the value of supplies of low-processed products increased by 5%, of highly-processed products – by 3%, and of unprocessed products – by 2%. Vegetable products constituted a half of the value of the overall agricultural and food imports. The cost of the supply of vegetable products increased by 3% in relation to 2013. To a greater extent, the export value increased in the case of processed vegetables (+15%), oil meals and feeds (+13%), as well as potatoes (+13%). Compared to the year before, more was also spent on the purchase of confectionery (+4%), grains (+4%), flowers (+6%), fresh vegetables (+2%) and fruit (+1%), as well as sauces, soups and thickeners (+3%). On the other hand, there was a decrease in expenditure on the imports of grain mill products (-16%), oilseeds (-8%), sugar and molasses (-13%), as well as vegetable fats and oils (-5%). The section of animal origin products had a share of approx. one-third in the import value of all agricultural and food products. Over the year, the value of imports of animal products increased by 2%.
Once again, the commodity with the highest value in purchases on foreign markets was pork, with a 4% decrease in expenses in comparison with 2013. There was a significant increase per annum in the value of imports of poultry meat (+21%), milk, cream and ice cream (+14%), cheese and curd (+12%), beef (+9%), sheep meat (+40%), horsemeat (+36%), and also, to a lesser extent, fish and crustaceans (+6%) as well as processed meat (+1%). Moreover, less was spent than in the year before on the purchase of animal fats and meal (-11%), butter (-4%) and processed fish (-7%). In the group of live animals, pigs remained the most important item in imports. However, the import value of these animals (mainly piglets) to Poland decreased by 6% in 2014. On the other hand, expenses on the purchase of live poultry (+27%) and cattle (+15%) were higher than the year before. In the section of other products, the greatest share in the value of imports (38%) comprised, traditionally, coffee, tea, cocoa and spices. In comparison with 2013, expenses on these goods increased by 3%. There was again an increase in value of the purchase of unmanufactured tobacco for the production of cigarettes (+20%), as well as, slightly, of alcohol and alcoholic drinks (+0.1%). On the other hand, the expenses on the import of waters and soft drinks dropped (-2%).
Geographical structure of the agricultural and food trade
For many years, Poland’s most important partner in the agricultural and food trade has been the European Union, and this was the case in 2014 as well. The balance of trade exchange with member states improved by almost 3% due to the growth dynamics of exports being slightly higher than that of imports. In 2014, the balance of trade exchange of agricultural and food products was positive, similarly as in several recent years, and totalled, in value terms, EUR 6.55 billion in comparison with EUR 6.11 billion in 2013, which relates to a 7% growth. In the previous year, the exported agricultural products reached a value higher by 5% – EUR 21.35 billion in comparison with EUR 20.43 billion the year before. Similarly, the value of imports showed an increase as well – a total amount of EUR 14.79 billion in comparison with EUR 14.31 billion the year before – a growth of nearly 4%. We sent considerably more of all agricultural products in terms of quantity – in total, we exported 20.44 million tons abroad in comparison with 18.64 million tons the year before; in terms of quantity, the exports increased by nearly 10%. We also imported more goods to Poland, by 7% - in total, 20.85 million tons in comparison with 19.46 million tons the year before.

In 2014, agricultural and food products worth EUR 16.87 billion were sold to the European Union, in comparison with EUR 15.98 billion the year before, which comprised as much as a 79% share in the total Polish agricultural and food exports. The value of the agricultural and food products exported from Poland to the countries of the EU-15 grouping reached a 59% share in total exports – EUR 12.57 billion, and to the remaining new member states, 20% – EUR 4.3 billion. In the previous year, as previously mentioned, a positive trade balance of agricultural and food trade with the EU was experienced again – it amounted to EUR 6.66 billion and was higher by 10% than in 2013. The improvement in the balance results was from better exports in this direction – an increase by 6% in comparison with 2013. In the period under consideration, goods worth approx. EUR 10.21 billion were brought to Poland from all countries of the Community, in comparison with EUR 9.94 billion (+3%), constituting a 69% share of total Polish agricultural and food imports. The value of agricultural and food products imported from the “EU-15” constituted 59% of the total value of the previous year’s imports of these products – EUR 8.76 billion, and from the “EU-13”, nearly 10% - EUR 1.44 billion.
In the previous year, we exported goods worth EUR 12.57 billion to the countries of “EU-15” in comparison with EUR 11.95 billion the year before, and EUR 4.30 billion to the “EU-13”, in comparison with more than EUR 4.02 billion in 2013 – in both cases, an increase in the value of Polish exports was recorded – by 5% in the former case and by 7% in the latter. Last year, imports from the Union “15” ended with a value of EUR 8.76 billion in comparison with EUR 8.47 billion the year before, and from the Union “13” – with an amount of 1.44 billion in comparison with EUR 1.47 billion, respectively. Thus, a 4% increase in the former and a 2% drop in the latter was recorded. In 2014, the trade balance for the countries of the EU-15 was positive, amounting to EUR 3.81 billion in comparison with EUR 3.48 billion the year before, and for the countries of the Union “13”, EUR 2.85 billion in comparison with EUR 2.55 billion the year before.
In general, in the previous year, we sent more in overall agricultural and food products to all countries of the Community in terms of quantity – 14.78 million tons; we also imported more agricultural and food products from this direction – 14.2 million tons. For comparison, the year before, these amounts totalled 13.99 million tons and 13.58 million tons, repectively.
In value terms, all EU markets were reached, above all, by traditionally processed Polish vegetable products – value: EUR 6.76 billion, with an approx. 32% share in the value of the total agricultural and food exports, as well as processed animal products – EUR 6.66 billion (a 31% share). In total, our exports of live animals, processed meat products, as well as vegetable raw materials and their preserves to the EU market had the value of EUR 13.42 billion – i.e., in total, 79% of the total exports of Polish agricultural products to the EU and 63% of overall exports. The most important items from the vegetable section in exports to the EU were confectionery – EUR 1.77 billion, processed fruit – EUR 933 million, grain – EUR 607 million, oil cake and feed components as well as feed – nearly EUR 524 million, processed vegetable – above EUR 492 million, and fresh vegetables – EUR 438 million. The section of animal products was dominated by red meats and offal – EUR 1.55 billion, poultry meats and offal – EUR 1.22 billion, fish and crustaceans – above EUR 960 million, processed meat – EUR 781 million, as well as milk, cream and ice cream – EUR 686 million. Another important item in exports to the EU countries were tobacco products – EUR 1.77 billion.

The imports of EU agricultural and food products was dominated, in value terms, by vegetables and processed vegetable products – EUR 5.02 billion, with a 49% share of the EU imports and a 34% share of total imports. Here, of greatest significance were confectionery – EUR 972 million, vegetable fats and oils – above EUR 623 million, and fresh fruit with EUR 603 million. In the imports of EU processed and unprocessed animal products (value: EUR 3.56 billion), the greatest quantities in the previous year were red meat and offal – EUR 1.4 billion. Moreover, of considerable significance in imports were coffee, cocoa, tea and spices – above EUR 504 million EUR, oil cake and feed ingredients, fish, as well as alcohol and alcoholic drinks.
The most important recipient of Polish agricultural and food products the year before, both in the EU market and outside it, was traditionally Germany. In 2014, it purchased products worth approx. EUR 4.81 billion (+2% increase in comparison with 2013) in Poland, constituting 22% of the total Polish agricultural and food exports and 28% of exports to all EU countries. As in every year, the goods sent in this direction included, above all, Polish vegetable products, both fresh and processed – EUR 2.34 billion, and processed animal products – EUR 1.02 billion. The highest receipts were gained from the export of fish and crustaceans – EUR 598 million, including, mainly, smoked fish, grain – EUR 455 million, confectionery – nearly EUR 438 million, and processed fruit – EUR 364 million. Another significant position comprised all sorts of meat and offal as well as dairy products.
The second most valuable outlet was again the United Kingdom with an amount of EUR 1.63 billion and a share of nearly 8% in the total Polish agricultural and food exports and 9% in exports to the EU countries. In the previous year, the value of agricultural and food products exported in this direction showed a 6% increase in value from EUR 1.54 billion the year before. The main products imported by the British from Poland were confectionery – EUR 347.0 million, processed meat – above EUR 278.0 million, poultry meat – nearly EUR 182.0 million, and processed fruit.
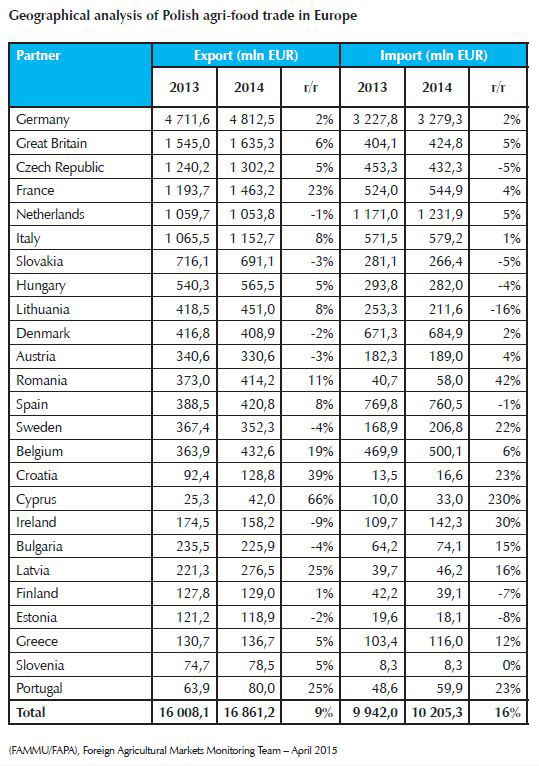
The top five recipients of Polish agricultural and food products among the European Union countries also included France (EUR 1.46 billion, a 23% increase in exports per annum), the Czech Republic (EUR 1.3 billion, a 5% increase) and Italy (EUR 1.15 billion, an 8% increase).
The second grouping after the European Union, to which we provide most agricultural and food products, is the organization known as the Eurasian Economic Union, comprising the CIS countries connected with a customs union – including Belarus, Kazakhstan, Kyrgyzstan, Russia, Armenia and Tajikistan. In 2014, sales to the EEU decreased in value terms by 24% per annum to EUR 1.23 billion, in comparison with EUR 1.63 billion the year before, and the share in the total Polish agricultural and food exports constituted less than 6%. Such a significant decline in the value of exports was caused by a significant reduction of exports to the Russian market, caused by the embargo. The structure of exports was dominated by fresh fruit – EUR 302 million, confectionery – EUR 136 million, and processed vegetables – EUR 123 million, as well as cheese and curd – above EUR 76 million. The biggest recipients from this grouping included Russia and Belarus. However, in 2014, Russia had reduced the value of agricultural and food imports from Poland by 30% to EUR 881.7 million, thus becoming, in value terms, the seventh largest recipient of agricultural and food products from Poland. The most important items in supplies to the Russian market in the previous year included fresh fruit – above EUR 318 million, red meat (pork) – EUR 137 million, fresh vegetables and their preserves, as well as cheese and curd. Russia’s share in exports to the grouping of the EEU countries constituted 71% in value terms and 4% of the total Polish exports of agricultural and food products. In the previous year, the value of exports to Belarus decreased by 7% to EUR 273 million, and the exports were dominated by fresh fruit and vegetables – in total, less than EUR 160 million, as well as dairy products and processed vegetables.
Other importers of agricultural and food products from Poland are the countries of the Eastern Partnership, comprising, among others, Azerbaijan, Georgia, Moldova and Ukraine which is the largest recipient of Polish agricultural and food products in this group. In 2014, the total exports to this group of countries ended with a value exceeding EUR 407 million, i.e. lower by 19% in comparison with the data for 2013 – EUR 503 million. The products we exported to Ukraine were worth above EUR 357 million, of which the largest group was fresh fruit – worth above EUR 71 million, confectionery, as well as coffee, cocoa and tea.
A considerable recipient is the NAFTA, i.e. the United States of America, Canada and Mexico, the previous year’s value of exports was EUR 364 million, i.e. 8% more than the year before. Exports in this direction constituted approx. 1.5% of the Polish agricultural and food exports in value terms. The greatest share (78%) in this grouping was to the United States; in 2014, the USA imported Polish agricultural and food products worth EUR 285 million, 14% more than in 2013, comprising mainly red meat and offal, confectionery, processed meat, and alcoholic drinks.
For many years, the most important supplier of agricultural and food products to Poland has been the European Union, with the value of imports in 2014 reaching EUR 10.21 billion, constituting a 70% share of the total imports.
In comparison with 2013, the value of these supplies increased by 3%. The greatest amounts were imported from the countries of EU-15 – EUR 8.76 billion (an increase by 3% per annum), comprising a 61% share in the total imports to Poland in value terms and 86% in supplies from the EU alone. The remaining amounts of agricultural and food products are imports from new EU member states – in 2014, the value of purchases reached EUR 1.44 billion and was lower by 2% than the year before.
From the EU countries, in total we imported a greater volume of agricultural and food products than in 2013 (an increase by 5%) – 14.2 million tons. The 2013 imports from the countries of EU-15 to Poland were dominated in value terms by pork – EUR 1.36 billion, and the consequent places were held by confectionery – EUR 809 million, fresh fruit – EUR 582 million, vegetable oils and fats, coffee, cocoa, tea and spices, as well as fresh vegetables and alcohol. The new member states’ exports to the Polish market included mainly red meat – EUR 192 million, confectionery – less than EUR 163 million, grain, vegetable oils and feed ingredients.
Outside the European Union, agricultural and food products of significant value are imported from the countries of the EFTA (including, above all, Norway, as mentioned below) – in the previous year, it was an amount above EUR 743 million, and the supplies were obviously dominated by fish and crustaceans with a total value of EUR 703 million. Other major suppliers to the Polish market are countries of the Mercosur group, including, above all, Argentina, Brazil and Paraguay – the total amount of supplies from this direction in the previous year exceeded EUR 984 million. Definitely, the most imported goods from these countries are oil cake, feed and feed ingredients – in total, above EUR 651 million, as well as tobacco and tobacco products. Moreover, nearly EUR 400 million is the value of Polish imports from the grouping of countries of the Eastern Partnership, including nearly EUR 360 million from Ukraine alone.
For years, Germany has been not only the greatest importer of Polish products, but also a country supplying agricultural and food products to Poland, with a 23% share in the total Polish agricultural and food imports and a 32% share in the 2014 imports from the EU countries. In the previous year, the value of products imported from Germany increased by 2% to EUR 3.28 billion, in comparison with EUR 3.22 billion the year before. The supplies were dominated by confectionery – less than EUR 461 million, red meat, including pork – EUR 445 million, coffee, cocoa, tea and vegetable oils – EUR 246 million, as well as vegetable fats and oils and feed.

Similarly as in the previous years, Poland’s second largest market for provision of agricultural and food products in 2014 were the Netherlands, where goods worth EUR 1.23 billion were purchased – a value higher by 5% than the year before – EUR 1.17 billion. In terms of goods, the greatest share of supplies traditionally comprised flowers – EUR 195 million, vegetable fats and oils – EUR 156 million, red meat – pork, as well as cocoa and coffee.
The third largest supplier of agricultural and food products to the Polish market was another member state - Spain, which reduced the value of products sent to our market by just 1%, to EUR 760.5 million. Spain has traditionally provided the Polish market with horticultural products – fresh fruit, above all, citrus fruit with a value of less than EUR 289.0 million, fresh vegetables – EUR 180 million, red meat, as well as processed fruit and vegetables.
The fourth position, once again, was occupied by Norway; in the previous year, it increased the value of products exported to Poland by 7%, to above EUR 688 million, in comparison with EUR 642 million the year before. From this country, we purchased, above all, fresh fish (salmon with a value above EUR 461 million) and processed fish with a total amount of EUR 666 million – a 97% share in supplies to the Polish market.
Lastly, the fifth position in the previous year was held by Denmark, providing us with goods worth 2% more than the year before – just under EUR 685 million. The supplies from Denmark were dominated by pork and pigs – in total, above EUR 435 million.
The next position among the leaders of exports to the Polish market was held by Argentina, which increased the value of products sent to Poland by 17% in comparison with the year before, to just under EUR 594 million. Approx. 85% of the value of imports from this country was soybean meal – EUR 506 million, an essential component for the production of industrial feed, as well as oilseeds and tobacco. Moreover, goods worth nearly EUR 580 million were provided by Italy – mainly fruit, confectionery and wines, France – EUR 545 million, and Belgium – EUR 500 million.
In 2014, the share of total exports to developed countries increased by 2 pp to 84%, the significance of the EU countries increased by the same value to 77%, the share of developed third countries remained stable (7%). In the case of developed countries, 2014 saw, nearly, an 8% increase in exports, whereas the dynamics in developed countries excluding the EU were significantly lower, approaching 3%. The share of the Eurozone in exports increased by 2 pp to 54%, and the positive dynamics of exports exceeded 9%. A higher growth rate of exports in this direction could be explained by the good economic situation. According to the International Monetary Fund, GDP increased in 2014 by 3.3% worldwide and by 1.8% in the developing countries. Improvement was also observed in Poland's main trade partners: Germany (+1.4%), France (+0.4%), the United Kingdom (+3.2%), whereas the GDP in the Eurozone increased by 0.8%. The share of exports in third countries (excluding developed ones) decreased by 2 pp to 16% due to an almost 6% drop of exports in this direction. Exports to the CIS dynamically decreased by almost 17%, and the share dropped to 8% (less by 2 pp YOY). The share of developed countries without the EU did not change (7%).
With regard to imports, a minimally higher growth rate was recorded than in exports (5.5 compared to 5.2%), the growth dynamics for the Eurozone were almost twice as high as for other EU countries, while purchases from the CIS and non-EU developed countries dropped (by slightly above 3% each). 65% of imports reached Poland from the developed countries (less by 1 pp), whereas imports from the EU amounted to 59% (+ 1 pp), and from the Eurozone, 46% (unchanged). The share of purchases in the CIS dropped by 1 pp to 13%. Due to a 14% growth in imports, the share of imports from third countries excluding developed ones and the CIS increased by 2 pp to 22%. Imports from developed countries (including the EU) showed positive dynamics (4.6%), although lower than the total imports (+5.5%), while the imports from third countries excluding developed ones increased at a rate higher than average (+7.2%), which allowed an increase of the shares of this group, in the geographical structure of the imports, by 1 pp to 35%.
Due to slightly higher growth dynamics in imports than in exports in 2014, the deficit in the balance of the foreign trade distinctly increased from EUR -1.984 billion to EUR -2.447 billion (+23%). It is also worth noticing a change in the growth rate of trade on a year-to-year basis: in 2013, exports increased by 8% YOY, and imports by 1.9%. In 2014, on the other hand, the growth rate of imports was 5.5% (strong growth YOY), and of exports, 5.2% (a distinct decrease). Trade with the EU countries showed a positive balance amounting to EUR 28.8 billion (including almost EUR 11.2 billion for the Eurozone), the trade with developed countries excluding the EU ended with a deficit of EUR 362 million, which, nevertheless, dropped by as much as 2/3 YOY. The trade exchange with developed countries in total ended with a high positive balance (EUR 28.4 billion). On the other hand, a large deficit had been recorded in the case of third countries excluding the developed ones (EUR -30.9 billion), which increased by 22%. The negative balance of trade with the CIS increased by as much as 29% to EUR -8.4 billion, and with other countries (excluding the developed ones and the CIS) increased by 19% to EUR -22.5 billion.
For many years, Germany has been the most important trade partner of Poland, both in exports and imports. In 2014, sales to the German market increased on a year-over-year basis by 10% to EUR 42.6 billion, while the imports increased by 7% to EUR 36.4 billion. In both cases, the growth dynamics were higher than in the total trade. Germany’s share in Polish trade, in the case of imports, remained unchanged at a level of 22%, and in exports it increased by 1 pp to 26%. Among the top ten largest outlets in value terms, only Russia (a 4% share) was outside the EU. In the case of imports, the top ten largest suppliers included three third countries: Russia (a 11% share), China (11%) and the USA (2%). Trade with the top ten trade partners constituted 65% of exports and 67% of total imports. It is worth noticing the large decrease in the dynamics of purchases from Russia (-9% YOY) and Ukraine (-27%, which made this country fall out of the top ten recipients).
The year 2014 brought a minimal drop in the share of agricultural and food products in the total Polish foreign trade, whereas the growth rate of food exports and imports was noticeably lower than the total trade. The share of exports dropped by 0.1 pp to 13.1%, and of imports, by 0.2 pp to 8.9%.
Of special interest is the slowdown of the growth rate of the share in exports, which had been growing quite strongly for the last three years. The dynamics of imports had been subject to minimal changes in the recent years. Despite weaker dynamics of trade in agricultural and food products than in total trade in 2014, the food trade balance has been positive for years, it increased by 7% to EUR 6.6 billion in 2014. The results of the Polish foreign trade in food, in 2014, were determined by exports to the CIS (-23% YOY), including, above all, Russia (-30%) and Ukraine (-22%), which is connected with the Russo-Ukrainian conflict, the Russian embargo on EU food (assorted products), and the strong depreciation of the rouble and hryvnia. The share of the CIS countries in the geographical structure of Polish food exports decreased in 2014 by 3 pp, from 11% to 8%.
The Ministry of Economic Affairs expects that in 2015, the total Polish exports will increase by 5.5% to EUR 172.1 billion, and the imports will grow slightly slower, by 5% to EUR 173.9 billion (after a study in March 2015). The deficit will amount to EUR 1.8 billion and will be lower in the year-over-year approach.
Commodity structure of the agricultural and food trade
In 2014, the positive balance in the Polish agricultural and food trade increased per annum by 7% to EUR 6.5 billion. The positive trade balance in the section of processed products of animal origin and stimulants improved. In the animal section, the value of the export of milk and dairy products, meat and poultry offal, as well as processed meats increased. The positive balance in the trade of red meat decreased, mainly due to a significant drop in the export of pork and beef. The negative balance in the trade of live animals deepened again due to the continuing high imports of piglets and an increase in the purchase of poultry and cattle. In the plant section, a positive trade balance was recorded again. This was mainly caused by an increase in the export of wheat, grain mill products, starch, feed components and confectionery. The positive balance in the trade of sugar decreased due to a drop in export.
Polish agricultural and food exports were dominated by low-processed products constituting 58% of their value. Highly-processed products had a share of 24%, and unprocessed products – 19%. In comparison with 2013, the share of highly-processed products increased by 1 pp.
The export value of low-processed products increased by 4%, and that of highly-processed products – by 8%, and of unprocessed products – by 3%. In 2014, the animal section saw a 13% decrease of positive balance in the trade of red meat, mainly due to a significant decrease of proceedings from the export of pork (-24%), beef (-19%), and horsemeat (-8%). The export value of poultry meat, on the other hand, increased by 22%, and in the case of sheep and goat meat, by 15%. An increase was also recorded in revenues from the foreign sales of powdered milk (+66%), whey (+10%), processed meats (+8%), honey (+36%), fish and crustaceans (+5%). The value of sales was lower than the year before in the field of live animals (-11%), mostly cattle and horses, as well as animal fats and meals (-16%), cheese and curd (-5%), eggs and egg products (-2%), butter (-1%).
In the vegetable section, as in earlier years, of greatest significance in their export were processed products, the export value of which in 2014, nevertheless, increased only slightly (+0.3%). This group saw an increase in proceeds from the sales of starch, meals and malt (+20%), oil meals, feed ingredients and feed (+8%), confectionery (+6%) and grain mill products (+2%). On the other hand, the export value of sugar was lower than the year before (-30%), due to a drop in its profitability. There were also reductions in earnings from the export of processed vegetables and fruit (-6%), sauces, soups and thickeners (-6%), as well as vegetable oils and fats (-1%). In the group of vegetable raw materials, a positive balance in foreign trade was recorded once more, however, it was lower by 16% than in 2013. A positive balance in the trade of grains increased per annum by one third due to an increase in exports by 21%, mostly of wheat. This was influenced by an increase in the profitability of exports from Poland and other EU countries, due to the loss of profitability of supplies of American wheat and the limitations of Russian export. On the other hand, 2014 saw a reduction in earnings from the export of Polish fruit (-18%), especially apples, due to the Russian embargo imposed in August of the previous year. There was also a decrease in the export value of oilseed rape (-11%), flowers (-12%), and potatoes (-6%).
The first item in the section of other products, and, at the same time, the product with the highest value in the commodity structure of agricultural and food exports, were cigarettes; their export value increased by 8% per year, and the value of total tobacco and tobacco products increased by 27%. There was also an increase in the re-exportation of cocoa, coffee, tea and spices (+15%), the export of waters and soft drinks, (+24%) as well as alcohol and alcoholic drinks (+5%).
The imports of agricultural and food products to Poland in 2014 were dominated, traditionally, by low-processed products (48% of the value of supplies). Unprocessed products had a 33% share in the value of purchases, and highly-processed products – a 19% share. Within a year, the value of supplies of low-processed products increased by 5%, of highly-processed products – by 3%, and of unprocessed products – by 2%. Vegetable products constituted a half of the value of the overall agricultural and food imports. The cost of the supply of vegetable products increased by 3% in relation to 2013. To a greater extent, the export value increased in the case of processed vegetables (+15%), oil meals and feeds (+13%), as well as potatoes (+13%). Compared to the year before, more was also spent on the purchase of confectionery (+4%), grains (+4%), flowers (+6%), fresh vegetables (+2%) and fruit (+1%), as well as sauces, soups and thickeners (+3%). On the other hand, there was a decrease in expenditure on the imports of grain mill products (-16%), oilseeds (-8%), sugar and molasses (-13%), as well as vegetable fats and oils (-5%). The section of animal origin products had a share of approx. one-third in the import value of all agricultural and food products. Over the year, the value of imports of animal products increased by 2%.
Once again, the commodity with the highest value in purchases on foreign markets was pork, with a 4% decrease in expenses in comparison with 2013. There was a significant increase per annum in the value of imports of poultry meat (+21%), milk, cream and ice cream (+14%), cheese and curd (+12%), beef (+9%), sheep meat (+40%), horsemeat (+36%), and also, to a lesser extent, fish and crustaceans (+6%) as well as processed meat (+1%). Moreover, less was spent than in the year before on the purchase of animal fats and meal (-11%), butter (-4%) and processed fish (-7%). In the group of live animals, pigs remained the most important item in imports. However, the import value of these animals (mainly piglets) to Poland decreased by 6% in 2014. On the other hand, expenses on the purchase of live poultry (+27%) and cattle (+15%) were higher than the year before. In the section of other products, the greatest share in the value of imports (38%) comprised, traditionally, coffee, tea, cocoa and spices. In comparison with 2013, expenses on these goods increased by 3%. There was again an increase in value of the purchase of unmanufactured tobacco for the production of cigarettes (+20%), as well as, slightly, of alcohol and alcoholic drinks (+0.1%). On the other hand, the expenses on the import of waters and soft drinks dropped (-2%).
Geographical structure of the agricultural and food trade
For many years, Poland’s most important partner in the agricultural and food trade has been the European Union, and this was the case in 2014 as well. The balance of trade exchange with member states improved by almost 3% due to the growth dynamics of exports being slightly higher than that of imports. In 2014, the balance of trade exchange of agricultural and food products was positive, similarly as in several recent years, and totalled, in value terms, EUR 6.55 billion in comparison with EUR 6.11 billion in 2013, which relates to a 7% growth. In the previous year, the exported agricultural products reached a value higher by 5% – EUR 21.35 billion in comparison with EUR 20.43 billion the year before. Similarly, the value of imports showed an increase as well – a total amount of EUR 14.79 billion in comparison with EUR 14.31 billion the year before – a growth of nearly 4%. We sent considerably more of all agricultural products in terms of quantity – in total, we exported 20.44 million tons abroad in comparison with 18.64 million tons the year before; in terms of quantity, the exports increased by nearly 10%. We also imported more goods to Poland, by 7% - in total, 20.85 million tons in comparison with 19.46 million tons the year before.
In 2014, agricultural and food products worth EUR 16.87 billion were sold to the European Union, in comparison with EUR 15.98 billion the year before, which comprised as much as a 79% share in the total Polish agricultural and food exports. The value of the agricultural and food products exported from Poland to the countries of the EU-15 grouping reached a 59% share in total exports – EUR 12.57 billion, and to the remaining new member states, 20% – EUR 4.3 billion. In the previous year, as previously mentioned, a positive trade balance of agricultural and food trade with the EU was experienced again – it amounted to EUR 6.66 billion and was higher by 10% than in 2013. The improvement in the balance results was from better exports in this direction – an increase by 6% in comparison with 2013. In the period under consideration, goods worth approx. EUR 10.21 billion were brought to Poland from all countries of the Community, in comparison with EUR 9.94 billion (+3%), constituting a 69% share of total Polish agricultural and food imports. The value of agricultural and food products imported from the “EU-15” constituted 59% of the total value of the previous year’s imports of these products – EUR 8.76 billion, and from the “EU-13”, nearly 10% - EUR 1.44 billion.
In the previous year, we exported goods worth EUR 12.57 billion to the countries of “EU-15” in comparison with EUR 11.95 billion the year before, and EUR 4.30 billion to the “EU-13”, in comparison with more than EUR 4.02 billion in 2013 – in both cases, an increase in the value of Polish exports was recorded – by 5% in the former case and by 7% in the latter. Last year, imports from the Union “15” ended with a value of EUR 8.76 billion in comparison with EUR 8.47 billion the year before, and from the Union “13” – with an amount of 1.44 billion in comparison with EUR 1.47 billion, respectively. Thus, a 4% increase in the former and a 2% drop in the latter was recorded. In 2014, the trade balance for the countries of the EU-15 was positive, amounting to EUR 3.81 billion in comparison with EUR 3.48 billion the year before, and for the countries of the Union “13”, EUR 2.85 billion in comparison with EUR 2.55 billion the year before.
In general, in the previous year, we sent more in overall agricultural and food products to all countries of the Community in terms of quantity – 14.78 million tons; we also imported more agricultural and food products from this direction – 14.2 million tons. For comparison, the year before, these amounts totalled 13.99 million tons and 13.58 million tons, repectively.
In value terms, all EU markets were reached, above all, by traditionally processed Polish vegetable products – value: EUR 6.76 billion, with an approx. 32% share in the value of the total agricultural and food exports, as well as processed animal products – EUR 6.66 billion (a 31% share). In total, our exports of live animals, processed meat products, as well as vegetable raw materials and their preserves to the EU market had the value of EUR 13.42 billion – i.e., in total, 79% of the total exports of Polish agricultural products to the EU and 63% of overall exports. The most important items from the vegetable section in exports to the EU were confectionery – EUR 1.77 billion, processed fruit – EUR 933 million, grain – EUR 607 million, oil cake and feed components as well as feed – nearly EUR 524 million, processed vegetable – above EUR 492 million, and fresh vegetables – EUR 438 million. The section of animal products was dominated by red meats and offal – EUR 1.55 billion, poultry meats and offal – EUR 1.22 billion, fish and crustaceans – above EUR 960 million, processed meat – EUR 781 million, as well as milk, cream and ice cream – EUR 686 million. Another important item in exports to the EU countries were tobacco products – EUR 1.77 billion.
The imports of EU agricultural and food products was dominated, in value terms, by vegetables and processed vegetable products – EUR 5.02 billion, with a 49% share of the EU imports and a 34% share of total imports. Here, of greatest significance were confectionery – EUR 972 million, vegetable fats and oils – above EUR 623 million, and fresh fruit with EUR 603 million. In the imports of EU processed and unprocessed animal products (value: EUR 3.56 billion), the greatest quantities in the previous year were red meat and offal – EUR 1.4 billion. Moreover, of considerable significance in imports were coffee, cocoa, tea and spices – above EUR 504 million EUR, oil cake and feed ingredients, fish, as well as alcohol and alcoholic drinks.
The most important recipient of Polish agricultural and food products the year before, both in the EU market and outside it, was traditionally Germany. In 2014, it purchased products worth approx. EUR 4.81 billion (+2% increase in comparison with 2013) in Poland, constituting 22% of the total Polish agricultural and food exports and 28% of exports to all EU countries. As in every year, the goods sent in this direction included, above all, Polish vegetable products, both fresh and processed – EUR 2.34 billion, and processed animal products – EUR 1.02 billion. The highest receipts were gained from the export of fish and crustaceans – EUR 598 million, including, mainly, smoked fish, grain – EUR 455 million, confectionery – nearly EUR 438 million, and processed fruit – EUR 364 million. Another significant position comprised all sorts of meat and offal as well as dairy products.
The second most valuable outlet was again the United Kingdom with an amount of EUR 1.63 billion and a share of nearly 8% in the total Polish agricultural and food exports and 9% in exports to the EU countries. In the previous year, the value of agricultural and food products exported in this direction showed a 6% increase in value from EUR 1.54 billion the year before. The main products imported by the British from Poland were confectionery – EUR 347.0 million, processed meat – above EUR 278.0 million, poultry meat – nearly EUR 182.0 million, and processed fruit.
The top five recipients of Polish agricultural and food products among the European Union countries also included France (EUR 1.46 billion, a 23% increase in exports per annum), the Czech Republic (EUR 1.3 billion, a 5% increase) and Italy (EUR 1.15 billion, an 8% increase).
The second grouping after the European Union, to which we provide most agricultural and food products, is the organization known as the Eurasian Economic Union, comprising the CIS countries connected with a customs union – including Belarus, Kazakhstan, Kyrgyzstan, Russia, Armenia and Tajikistan. In 2014, sales to the EEU decreased in value terms by 24% per annum to EUR 1.23 billion, in comparison with EUR 1.63 billion the year before, and the share in the total Polish agricultural and food exports constituted less than 6%. Such a significant decline in the value of exports was caused by a significant reduction of exports to the Russian market, caused by the embargo. The structure of exports was dominated by fresh fruit – EUR 302 million, confectionery – EUR 136 million, and processed vegetables – EUR 123 million, as well as cheese and curd – above EUR 76 million. The biggest recipients from this grouping included Russia and Belarus. However, in 2014, Russia had reduced the value of agricultural and food imports from Poland by 30% to EUR 881.7 million, thus becoming, in value terms, the seventh largest recipient of agricultural and food products from Poland. The most important items in supplies to the Russian market in the previous year included fresh fruit – above EUR 318 million, red meat (pork) – EUR 137 million, fresh vegetables and their preserves, as well as cheese and curd. Russia’s share in exports to the grouping of the EEU countries constituted 71% in value terms and 4% of the total Polish exports of agricultural and food products. In the previous year, the value of exports to Belarus decreased by 7% to EUR 273 million, and the exports were dominated by fresh fruit and vegetables – in total, less than EUR 160 million, as well as dairy products and processed vegetables.
Other importers of agricultural and food products from Poland are the countries of the Eastern Partnership, comprising, among others, Azerbaijan, Georgia, Moldova and Ukraine which is the largest recipient of Polish agricultural and food products in this group. In 2014, the total exports to this group of countries ended with a value exceeding EUR 407 million, i.e. lower by 19% in comparison with the data for 2013 – EUR 503 million. The products we exported to Ukraine were worth above EUR 357 million, of which the largest group was fresh fruit – worth above EUR 71 million, confectionery, as well as coffee, cocoa and tea.
A considerable recipient is the NAFTA, i.e. the United States of America, Canada and Mexico, the previous year’s value of exports was EUR 364 million, i.e. 8% more than the year before. Exports in this direction constituted approx. 1.5% of the Polish agricultural and food exports in value terms. The greatest share (78%) in this grouping was to the United States; in 2014, the USA imported Polish agricultural and food products worth EUR 285 million, 14% more than in 2013, comprising mainly red meat and offal, confectionery, processed meat, and alcoholic drinks.
For many years, the most important supplier of agricultural and food products to Poland has been the European Union, with the value of imports in 2014 reaching EUR 10.21 billion, constituting a 70% share of the total imports.
In comparison with 2013, the value of these supplies increased by 3%. The greatest amounts were imported from the countries of EU-15 – EUR 8.76 billion (an increase by 3% per annum), comprising a 61% share in the total imports to Poland in value terms and 86% in supplies from the EU alone. The remaining amounts of agricultural and food products are imports from new EU member states – in 2014, the value of purchases reached EUR 1.44 billion and was lower by 2% than the year before.
From the EU countries, in total we imported a greater volume of agricultural and food products than in 2013 (an increase by 5%) – 14.2 million tons. The 2013 imports from the countries of EU-15 to Poland were dominated in value terms by pork – EUR 1.36 billion, and the consequent places were held by confectionery – EUR 809 million, fresh fruit – EUR 582 million, vegetable oils and fats, coffee, cocoa, tea and spices, as well as fresh vegetables and alcohol. The new member states’ exports to the Polish market included mainly red meat – EUR 192 million, confectionery – less than EUR 163 million, grain, vegetable oils and feed ingredients.
Outside the European Union, agricultural and food products of significant value are imported from the countries of the EFTA (including, above all, Norway, as mentioned below) – in the previous year, it was an amount above EUR 743 million, and the supplies were obviously dominated by fish and crustaceans with a total value of EUR 703 million. Other major suppliers to the Polish market are countries of the Mercosur group, including, above all, Argentina, Brazil and Paraguay – the total amount of supplies from this direction in the previous year exceeded EUR 984 million. Definitely, the most imported goods from these countries are oil cake, feed and feed ingredients – in total, above EUR 651 million, as well as tobacco and tobacco products. Moreover, nearly EUR 400 million is the value of Polish imports from the grouping of countries of the Eastern Partnership, including nearly EUR 360 million from Ukraine alone.
For years, Germany has been not only the greatest importer of Polish products, but also a country supplying agricultural and food products to Poland, with a 23% share in the total Polish agricultural and food imports and a 32% share in the 2014 imports from the EU countries. In the previous year, the value of products imported from Germany increased by 2% to EUR 3.28 billion, in comparison with EUR 3.22 billion the year before. The supplies were dominated by confectionery – less than EUR 461 million, red meat, including pork – EUR 445 million, coffee, cocoa, tea and vegetable oils – EUR 246 million, as well as vegetable fats and oils and feed.
Similarly as in the previous years, Poland’s second largest market for provision of agricultural and food products in 2014 were the Netherlands, where goods worth EUR 1.23 billion were purchased – a value higher by 5% than the year before – EUR 1.17 billion. In terms of goods, the greatest share of supplies traditionally comprised flowers – EUR 195 million, vegetable fats and oils – EUR 156 million, red meat – pork, as well as cocoa and coffee.
The third largest supplier of agricultural and food products to the Polish market was another member state - Spain, which reduced the value of products sent to our market by just 1%, to EUR 760.5 million. Spain has traditionally provided the Polish market with horticultural products – fresh fruit, above all, citrus fruit with a value of less than EUR 289.0 million, fresh vegetables – EUR 180 million, red meat, as well as processed fruit and vegetables.
The fourth position, once again, was occupied by Norway; in the previous year, it increased the value of products exported to Poland by 7%, to above EUR 688 million, in comparison with EUR 642 million the year before. From this country, we purchased, above all, fresh fish (salmon with a value above EUR 461 million) and processed fish with a total amount of EUR 666 million – a 97% share in supplies to the Polish market.
Lastly, the fifth position in the previous year was held by Denmark, providing us with goods worth 2% more than the year before – just under EUR 685 million. The supplies from Denmark were dominated by pork and pigs – in total, above EUR 435 million.
The next position among the leaders of exports to the Polish market was held by Argentina, which increased the value of products sent to Poland by 17% in comparison with the year before, to just under EUR 594 million. Approx. 85% of the value of imports from this country was soybean meal – EUR 506 million, an essential component for the production of industrial feed, as well as oilseeds and tobacco. Moreover, goods worth nearly EUR 580 million were provided by Italy – mainly fruit, confectionery and wines, France – EUR 545 million, and Belgium – EUR 500 million.


